
NEWS
Permafrost Thaw Runs Fastest in Mountains, Not Arctic Soils
A 156-site survey finds mountain thaw layers growing more than ten times faster than Arctic soils, while sinking ice-rich ground hides carbon release.

Field crews at 156 sites found the seasonal thaw layer over permafrost grew across the Arctic, Antarctic, and mountains from 2000 to 2024. The paper, published 26 August 2026 in Communications Earth and Environment, treats that layer as the World Meteorological Organization’s Essential Climate Variable for permafrost.
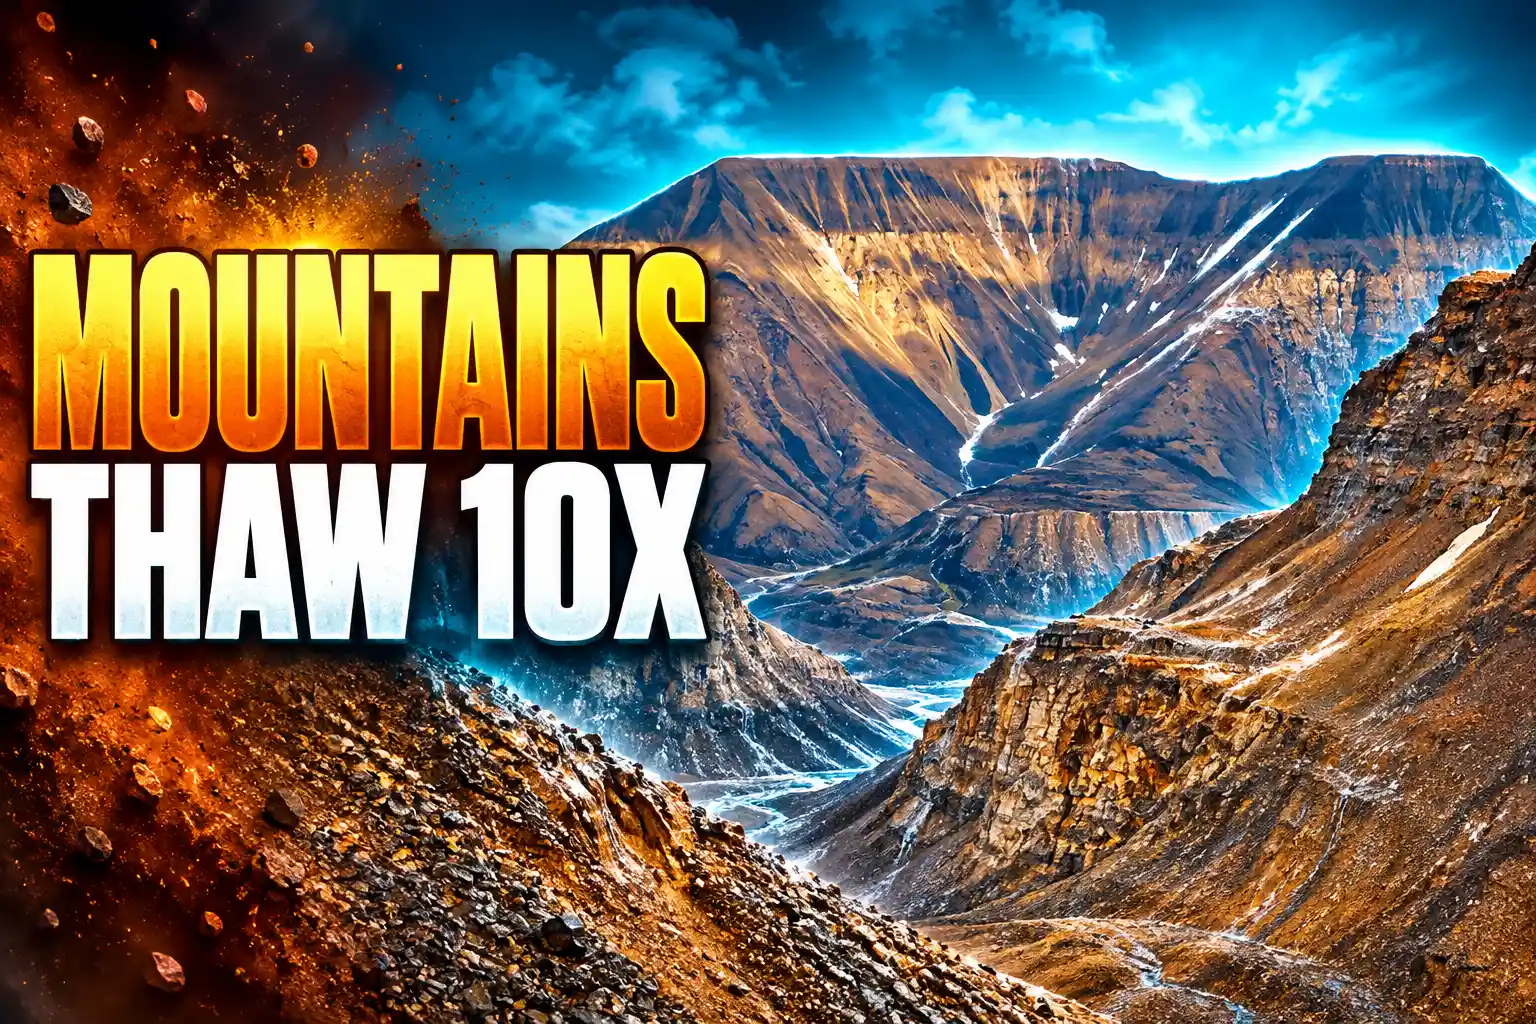
The surprise is where the probe moved. European mountain sites thickened by 10.3 cm per year on average, more than ten times the Arctic’s 0.8 cm per year, while the carbon-rich soils that dominate climate talk barely budged on the tape.
Long-term monitoring of active layer thickness confirms global permafrost degradation https://t.co/HiMJiYabVI pic.twitter.com/xj76pQsIod
— Communications Earth & Environment (@CommsEarth) August 26, 2026
A Quarter-Century of Probes, From Alaska to the Andes
Dmitry A. Streletskiy, a geographer at George Washington University, led a team that started with 316 Circumpolar Active Layer Monitoring sites and kept the 156 that had at least ten years of measurements between 2000 and 2024. The mean record is 20 years. One hundred thirty-seven of the sites sit in the Northern Hemisphere and 19 in the south.
The network that supplied those holes is CALM, which began in 1991 at Utqiaġvik, Alaska, as a recovery effort for old thaw records and now runs long-term active-layer observations worldwide with participants in 15 countries. Crews measure the layer that freezes and thaws each year with a metal probe, a thaw tube, or temperature sensors in a borehole. In mountain bedrock, temperature interpolation is often the only method that works.
North America supplied 45 sites, 35 of them in continuous permafrost in Alaska and northwestern Canada. Eurasia supplied 92, stretching from the Nordic Arctic and the Alps through Siberia to Mongolia and the Qinghai-Tibet Plateau. Antarctica supplied 16, half of them on the Peninsula. The dry central Andes supplied three sites on the Morenas Coloradas rock glacier in Mendoza, Argentina.
THE CALM RECORD
- 1991: CALM is set up in Utqiaġvik to archive and standardize active-layer measurements.
- 1995: The U.S. National Science Foundation begins funding the coordination of the network.
- 2007 to 2009: The Fourth International Polar Year adds sites in the Southern Hemisphere.
- 2022: Reporting from Russia drops sharply, cutting coverage across about half of that country’s permafrost.
- 2024: The last year in the 156-site trend analysis.
- 26 August 2026: Communications Earth and Environment publishes the global synthesis.
Sites scarred by fire, or already sitting over a talik (a pocket of ground that no longer freezes in winter), were dropped so the trends would describe undisturbed ground. That choice makes the remaining numbers conservative, and it also means the paper is silent on some of the fastest local collapse.
The Active Layer Grew Fastest Where the Ice Was Thinnest
In the Northern Hemisphere, 66.4% of sites (91 of 137) showed a statistically significant thickening, 32.1% showed no significant change, and two sites, 1.5%, thinned. Only 42.1% of Southern Hemisphere sites thickened with statistical confidence. The regional averages hide a clean physical split: ice-poor bedrock raced, ice-rich peat crawled.
| Region | Share of sites with a significant increase | Mean change (cm per year) |
|---|---|---|
| European mountains | 94.7% (18 sites) | 10.3 ± 9.9 |
| Third Pole (Mongolia and the Qinghai-Tibet Plateau) | 90.9% (20 sites) | 3.2 ± 2.1 |
| Arctic | 55.2% (53 sites) | 0.8 ± 0.8 |
| Antarctic | 37.5% of 16 sites | 2.5 ± 2.8 |
| Central Andes | Two of three sites | 2.0 to 6.0 |
| North American continuous permafrost | – | 0.4 |
| North American discontinuous permafrost | – | 1.0 |
| Eurasian Arctic continuous permafrost | – | 0.8 ± 1.0 |
| Eurasian Arctic discontinuous permafrost | – | 2.3 ± 1.1 |
That table inverts the better-known map of permafrost temperature. Cold, continuous permafrost has warmed faster at depth, because little of the extra heat is spent on melting ice. Warm, discontinuous, and mountain ground sits closer to 0 °C, so more of the heat goes into thaw, and the active layer thickens. Streletskiy and colleagues write that the largest jumps were in mountain permafrost, typically bedrock with low to medium ice, and that Arctic and Antarctic lowlands in fine-grained sediments changed much less.
On Alaska’s North Slope, most continuous-permafrost sites rose 0.3 to 0.6 cm per year, with no statistically significant change where thick organic mats still cap the soil. Interior Alaska, on discontinuous permafrost, rose 0.5 to 2.6 cm per year. In Eurasia the same contrast holds: 0.8 cm per year in continuous Arctic ground against 2.3 cm per year in discontinuous ground. Mongolia’s grassy steppes above 1,300 meters rose 1.2 to 5.4 cm per year, faster on the drier, low-ice plots.
Why Arctic Probes Can Miss the Thaw
A probe measures the distance from today’s surface to the frost table. If the surface itself is sinking, that tape can look almost still while ice at the top of the permafrost is melting. The paper flags this directly for ice-rich fine-grained sediments, and it is the reason the Arctic’s modest centimeters should not be read as safety.
ALT as measured against a relative ground surface in areas of ice-rich permafrost may not provide a full indication of the permafrost system’s response to climate change.
Dmitry A. Streletskiy and colleagues, Communications Earth and Environment
WHAT THE SINKING SURFACE HIDES
- The mechanism: Melting excess ice consolidates the soil column, so the ground surface drops as the thaw front moves down.
- Alaska grids: At four plots near Utqiaġvik first laid out in 1962, Streletskiy and co-authors earlier reported 0.4 to 1.0 cm of subsidence per year from 2003 to 2015, an 8 to 15 cm drop that left probe depths looking stable.
- Pan-Arctic rates: A 2025 Environmental Research Letters review led by the same group found thaw subsidence of up to 2 cm per year in low-ice ground and more than 3 cm per year in ice-rich ground.
- Carbon on the tape: In a 2020 warming experiment, Heidi Rodenhizer and colleagues found that once subsidence was added back, thaw ran 19% to 49% deeper than active-layer thickness implied, and newly thawed carbon was 37% to 113% greater.
Peat and thick organic horizons also blunt the probe. Their high ice content soaks up heat as latent heat, so a warm summer can leave the frost table almost where it was. The authors found the weakest climate-to-thaw link at moist, vegetated, silty, and peaty sites, and the strongest at drier, sandy, sparsely vegetated ground. That is why a North Slope grid with a fat peat cap can look unchanged beside a burned or sandy plot that is dropping a couple of centimeters a year.
Northern permafrost-region soils hold about 1,460 to 1,600 billion metric tons of organic carbon, roughly twice the carbon now in the air, with about 1,035 billion tons in the top 3 meters, according to inventories used by NOAA and the IPCC. Those stocks sit in the same ice-rich lowlands whose probe records look quiet. A small number on a CALM grid there is not a small problem.
European Mountains Doubled Their Seasonal Thaw
Mountain sites are the other half of the inversion. Active-layer thickness there already spans about 100 cm to more than 500 cm, and some boreholes in Norway, France, and Switzerland reported more than 700 cm after 2020. At Schilthorn in the Swiss Alps, the 2022 thaw exceeded 1,300 cm, the highest value in the compilation, checked in several holes at the same site. Swiss Alpine sites in the paper range from a 0.5 cm per year decrease at one hole to increases of 0.9 to 36.2 cm per year at others. Italian Alpine sites rose 9.7 to 20.2 cm per year; French sites 7.7 to 17.6.
Ice-poor, conductive bedrock takes summer heat straight down. When ice plugs in fractured rock melt, water can run into the mass and speed the next year’s thaw. Ice-rich mountain permafrost does the opposite, spending heat on latent melt, so neighboring holes can tell opposite stories. The European mountain average of 10.3 cm per year is a mean across that spread, not a single slope’s fate.
Those meters of new seasonal thaw sit under huts, cable-car pylons, and valley towns. PERMOS, the Swiss monitoring network, recorded a rockfall in September 2023 that wrecked instruments on the Murtèl-Corvatsch rock glacier and ended the longest mountain permafrost temperature series in that country. A University of Innsbruck volume on Bernese Oberland hazards notes that the Swiss Alpine Club hut on the Mutthorn has been closed since 2022 because of rockfall, and that the Spitze Stei slope above Kandersteg, where permafrost is confirmed in boreholes, is moving on the order of meters per year. In July 2022, Jan Beutel, a University of Innsbruck professor who also guides in the Alps, wrote that seasonal thaw had crossed 1 m at 4,000 m beside the Solvay Hut on the Matterhorn, with rock-surface temperatures peaking at 20 °C.
MOUNTAIN GROUND ALREADY MOVING
- Schilthorn, Swiss Alps: Thaw deeper than 1,300 cm in 2022, confirmed in multiple boreholes.
- Murtèl-Corvatsch: September 2023 rockfall destroyed the instruments and cut off the longest Swiss mountain permafrost temperature record.
- Mutthorn hut: Closed since 2022 under rockfall risk from a mass the Innsbruck assessment puts at well over 1 million cubic meters, creeping 10 to 30 cm per year.
- Matterhorn flank: A rock pillar failed on 13 June 2023, on the same week as larger failures at Fluchthorn and Piz de las Sterlas, after water-driven thaw in jointed rock.
The Andes sample is tiny, three sites, but it rhymes with the Alps. At the two higher Morenas Coloradas holes, thaw ran 2.0 to 6.1 cm per year. The lowest site, already hosting an intra-permafrost talik deeper than 800 cm, was left out of regional averages because summer air no longer controls the top of permafrost there. Warm Zonda winds still peel snow off early, so thaw starts sooner even in a dry range that never sees Alpine snowpacks.
Summer Heat, Then Rain, Drives Arctic Thickening
For the Arctic and European mountain sites with nearly complete series, the team pulled thawing degree-days, freezing degree-days, rain, and snow from ERA5-Land, the Copernicus reanalysis on a 0.1-degree grid, and ran panel regressions with site and year fixed effects. That design asks how a given site changes when its own climate changes, instead of comparing a cold peat bog with a warm gravel bar.
ARCTIC CLIMATE COEFFICIENTS
- Summer warmth: A one-unit rise in the square root of thawing degree-days thickens the active layer by 1.05 cm (p less than 0.01), the same estimate whether errors are clustered by site or corrected for spatial correlation.
- A worked example: Moving from a square-root thawing-degree-day value of 40 to 50, about 7.5 °C of extra warmth over a four-month thaw season, implies roughly 10.5 cm of extra Arctic thaw.
- Rain: Each extra millimeter of liquid precipitation adds 0.016 cm of thaw (p less than 0.05), about 0.16 cm per extra centimeter of rain.
- Winter cold and snow: Freezing degree-days and solid precipitation drop out once site differences are stripped away; the apparent winter effect in simple regressions was a map of latitude, not a cause.
The fixed-effects model explains 92% of Arctic active-layer variation, against 27% for ordinary least squares, which is a polite way of saying vegetation, soil, and ice content still dwarf year-to-year weather. Mountain coefficients point the same way, a 4.51 cm response to the same summer-warmth unit, but the confidence intervals are wide. Europe has few long mountain series, ERA5-Land is coarse against ridgelines, and the paper will not claim a clean climate driver there.
Antarctic records remain the weakest. Sixteen sites with ten-year series, eight of them on the Peninsula, show 2.5 cm per year on average where trends pass a test, and no significant trend in the Dry Valleys and much of Victoria Land. Earlier Peninsula cooling had thinned the layer by 0.1 to 1.6 cm per year from 2006 to 2015; after 2015 the sign flipped. Maritime Signy Island ran as high as 7.2 cm per year. Salt in Antarctic soils can also push the 0 °C isotherm away from the true thaw depth, so a borehole and a probe at the same place need not agree.
Russian Reporting Fell Off After 2022
The authors say permafrost degradation in this century is broader than earlier regional papers had shown, and they also say the map still has holes that no reanalysis can fill. The number of Russian sites reporting fell after 2022, which limits any estimate for about half of that country’s permafrost, a share large enough to move a “global” mean. The Bulletin of the American Meteorological Society’s later climate assessments have kept the same warning: little or no 2025 data from the Russian European North, and almost none from West and East Siberia.
CALM itself is uneven for older reasons. Sites cluster near stations, roads, Indigenous settlements, and mines because polar logistics are expensive. Grids go dark when money stops, when a hole floods, or when a slope becomes unsafe. COVID-19 already punched gaps in visits. The paper names the Canadian Arctic Archipelago, western Greenland, the Russian Arctic islands, mountain ranges in North America and Central Asia, and the Hindu Kush Himalaya as places that still need holes. GTN-P’s public portal listed 256 active layer thickness sites in January 2026, and only 105 of them actually hold data.
The compiled active-layer thickness records from this study are posted on figshare, with the operational series also at CALM and GTN-P. They show a planet whose seasonal thaw layer is deepening in most of the places anyone has measured for 25 years, fastest in ice-poor mountains that drop rock onto huts and roads, slowest on the ice-rich Arctic plains that store the carbon, where the surface is sinking under the probe. The next quarter-century of that map still depends on crews who can reach the blank squares.
Frequently Asked Questions
What Is the Active Layer in Permafrost?
Permafrost is ground that stays at or below 0 °C for two years or longer. The active layer is the soil or rock above it that either crosses 0 °C each year (the thermal definition) or actually freezes and thaws (the phase-based definition). Its ice can store about ten times as much heat, as latent heat, as the same material stores by simply warming, which is why ice-rich peat thaws more slowly than dry bedrock under the same air temperature.
How Do Scientists Measure Active Layer Thickness?
Three field methods are accepted. Mechanical probing with a graduated rod along a grid, often 100 by 100 m with 121 nodes, has a precision of 0.5 cm and an accuracy of about 2 cm. Thaw tubes read to 1 mm with about 2 cm accuracy. Borehole thermistors, logging as often as every hour, are typically accurate to between 0.01 °C and 0.25 °C, and thickness is interpolated to the 0 °C depth, with error that grows when sensors are widely spaced. In saline soils, common in parts of Antarctica and northern West Siberia, the 0 °C isotherm and the true thaw depth can part company, so a site should stick to one method if the goal is a trend.
What Is the Difference Between Continuous and Discontinuous Permafrost?
On the Circum-Arctic map used in the paper, continuous permafrost underlies at least 90% of the land, discontinuous 50 to 90%, sporadic 10 to 50%, and isolated patches less than 10%. Continuous zones are colder and often richer in ground ice, so more incoming heat is spent melting ice rather than pushing the frost table down. That is the main reason this survey’s continuous Arctic sites thickened more slowly than discontinuous sites in Interior Alaska, the European Arctic, and West Siberia.
How Much Carbon Is Stored in Northern Permafrost Soils?
Inventories compiled by Hugelius, Schuur, and others, and cited by NOAA’s Arctic Report Card and the IPCC, put organic carbon in the northern permafrost region at 1,460 to 1,600 billion metric tons, of which 1,035 ± 150 billion tons sit in the top 3 m. Yedoma silt in Siberia and Alaska holds another 327 to 466 billion tons in much thicker deposits. Mishra and colleagues’ 2021 map of the Northern Hemisphere permafrost region found about 1,014 billion tons to 3 m, 1,000 of them circumpolar and 14 on the Tibetan Plateau. None of those stocks is in the European Alpine bedrock that produced this paper’s largest active-layer trends.

Bass Persuades Takes the Record Drop After a No. 1 Debut

DIGITALEUROPE Says Europe Must Buy From Its Scaleups

Refugees Lose Medicaid While Green Cards Sit in Line

Ring Smart Lock Puts Your Door on Amazon Sidewalk

Sicario 3 Moves Ahead Without Taylor Sheridan Writing

The Last Manual V-12 Lamborghini Cannot Come to America

Influencer Investors Trade Cash Fees for Illiquid Equity

The Roman Space Telescope Flies After Four Budget Fights

Software Stocks Rally as Underweight Funds Face Dreamforce

Rune Bets on Hillerød for His Achilles Comeback
-
 AUTO1 month ago
The Last Manual V-12 Lamborghini Cannot Come to America
-
 BUSINESS1 month ago
Influencer Investors Trade Cash Fees for Illiquid Equity
-
 NEWS1 month ago
The Roman Space Telescope Flies After Four Budget Fights
-
 BUSINESS1 month ago
Software Stocks Rally as Underweight Funds Face Dreamforce
-
 NEWS2 months ago
Rune Bets on Hillerød for His Achilles Comeback
-

 BUSINESS2 months ago
Rubicon Research Q1 Tests Its Specialty Pharma Bet
-

 NEWS2 months ago
Hamilton’s Ferrari Upgrade Pushes Mercedes Into a Monza Bind
-

 BUSINESS1 month ago
JBS’s Pilgrim’s Pride Bid Still Needs the 18 Percent